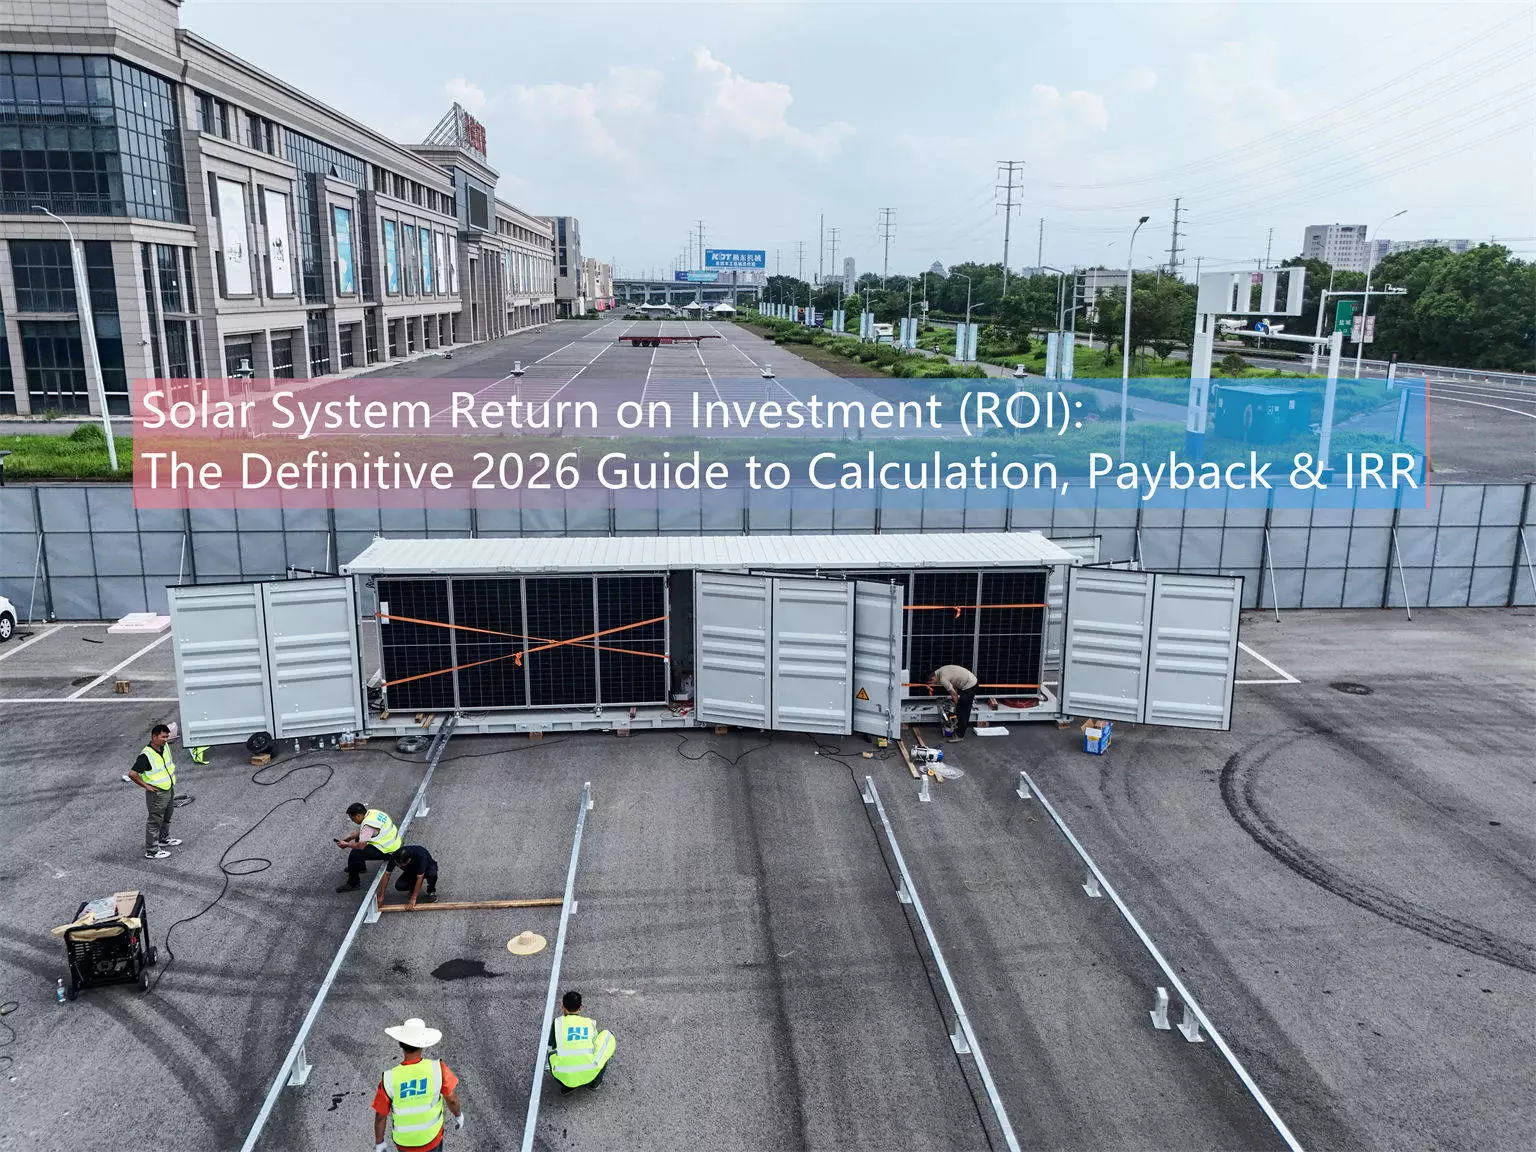
Solar System Return on Investment (ROI): The Definitive 2026 Guide to Calculation, Payback & IRR
With rising energy costs and an increasing global focus on sustainable development, investing in solar photovoltaic (PV) systems has evolved from a purely environmental initiative into a crucial financial decision. For both residential and commercial users, the core issue is no longer limited to environmental benefits, but rather how to measure the economic value of a solar system through its Return on Investment (ROI).
This article provides an in-depth analysis of the financial aspects of solar energy investment, helping you better calculate the ROI of a PV system in 2026. We will explore various factors influencing ROI from multiple perspectives and provide a practical framework to help you make informed decisions regarding your solar investment.
Key Financial Metrics: Understanding ROI, Payback Period, and Internal Rate of Return (IRR)
When evaluating a solar investment, there are three key financial metrics you need to understand:
- Return on Investment (ROI)
ROI is the core metric for assessing the profitability of a solar system. It measures the net return relative to the initial investment. For instance, a 15 MW commercial solar plant in Bangladesh achieved a 389% ROI, demonstrating the potential profitability of large-scale projects. - Solar Payback Period
The solar payback period refers to how long it takes to recover the initial investment through electricity savings. Research shows that grid-connected solar systems typically have a payback period of 5.5 to 7 years, while off-grid systems with battery storage often have longer payback periods, frequently exceeding 19.9 years, due to the higher upfront cost of batteries. In locations such as South Sudan, off-grid solar systems have a payback period of approximately 5.5 years, making them a more cost-effective alternative to diesel generators. - Internal Rate of Return (IRR)
IRR is the annualized compounded ROI, which takes into account the time value of money. This metric is crucial for comparing different investment options over time. Even a 2.5% difference in IRR can have a significant impact on a project’s overall profitability.

Factors Affecting Solar ROI
Several factors influence the actual ROI of a solar system. These key factors include:
- System Configuration: Grid-connected vs. Off-grid
The decision between a grid-connected system and an off-grid system with battery storage is one of the most significant factors in determining both the cost and the investment payback.Grid-connected systems are typically the most cost-effective option. According to 2025 cost models, grid-tied systems usually have a payback period ranging from 5.5 to 7 years. Additionally, they can increase ROI by selling excess electricity back to the grid through net metering (where available).
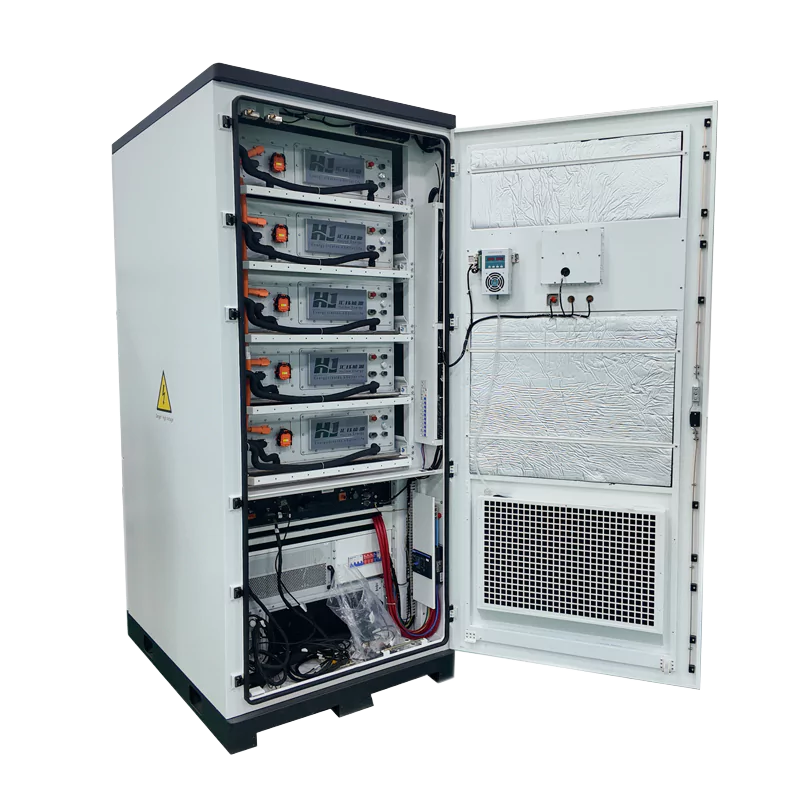
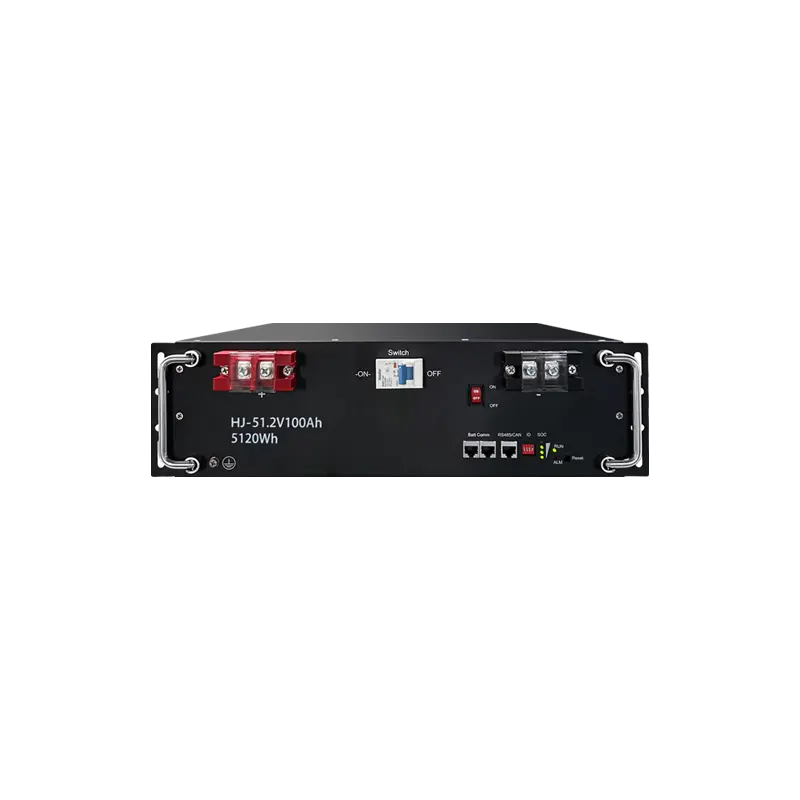
Off-grid systems with battery storage, while offering energy independence, tend to have longer payback periods. Studies show that the battery costs can account for up to 74.6% of the total lifecycle cost, significantly extending the solar payback period but offering greater reliability and energy autonomy.
- Technology Choice: Improving Efficiency
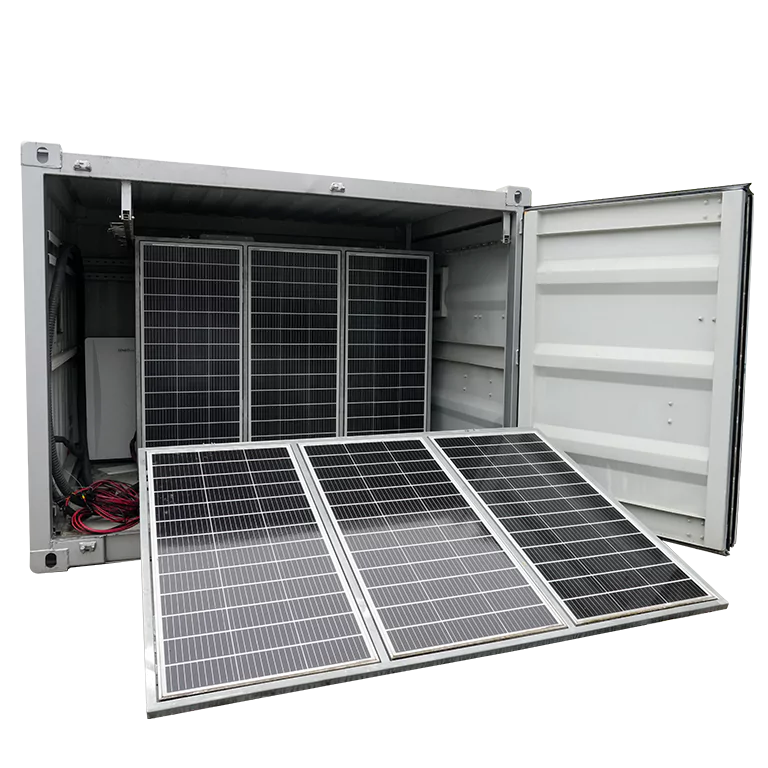
The type of solar panels and their technology directly influence energy production and the financial return on solar energy.Bifacial solar panels are becoming increasingly popular. These panels absorb sunlight from both sides, and in favorable conditions (such as sandy or snow-covered ground), they can increase energy production by 5.3% to 16.55% more than traditional monofacial panels.
TOPCon technology (Tunneled Oxidation Passivated Contact) is another emerging technology. It performs better in low-light conditions, and studies show that TOPCon panels can generate about 1.7% more energy per watt compared to some traditional technologies, lowering the Levelized Cost of Electricity (LCOE) and improving overall ROI.
- Policy and Financial Environment
Various incentives and financial conditions can also affect the financial return on solar:Incentives: For example, in the United States, the 30% federal investment tax credit (ITC) can reduce system costs by one-third, significantly improving the ROI. Additionally, state or local incentives may further lower initial investment costs.
Electricity prices: Areas with higher electricity rates typically see shorter payback periods, as the savings per kilowatt-hour of electricity are greater. Conversely, areas with lower electricity rates may have longer payback periods.
Inflation hedge: As electricity prices rise due to inflation, the value of your self-generated electricity increases, further enhancing your solar system’s return on investment.
Practical Applications of Solar ROI: Comparative Analysis and Case Data
Below is a table summarizing real-world data on the ROI and payback periods of solar systems in various regions and configurations:
| System Type & Location | System Capacity | Key Financial Indicators | Results | Main Influencing Factors |
|---|---|---|---|---|
| Bangladesh Commercial Grid-Connected | 15 MW | Payback Period / ROI | 4.5 years / 389% | High Emissivity, Large Scale Project |
| Residential Grid-Connected (Model) | 10 kWp | Discounted Payback Period (DPB) | 5.5 – 7.0 years | High Electricity Prices, No Battery |
| Off-Grid (with Storage) | 10 kWp | Discounted Payback Period (DPB) | ≥19.9 years | High Battery Replacement Costs |
| Off-Grid vs. Diesel (South Sudan) | Not Specified | Payback Period / ROI | ~5.5 years / 11% | High diesel costs |
| Residential with Battery (Mali) | 3-4 kW | ROI (future cost case) | 90% – 130% | High Solar Potential, 95% Self-sufficiency Target |
How to Calculate Your Solar System ROI: A Simplified Framework
You can estimate your solar payback period and investment return using the following steps:
- Estimate System Costs: Get a quote from your installer, factoring in any applicable incentives (e.g., federal tax credits). For example, a 5 kW system costing $19,000 might cost $13,300 after tax credits.
- Project Annual Generation: Your installer will estimate how much electricity (in kWh) your system will generate based on your location and system size.
- Calculate Electricity Savings: Multiply your annual generation by the local electricity rate. If applicable, factor in any net metering or Renewable Energy Credits (SREC) programs.
- Cash Flow Model: Account for panel degradation (the decrease in electricity generation over time), potential increases in electricity rates, and future costs for battery replacements or other system components.
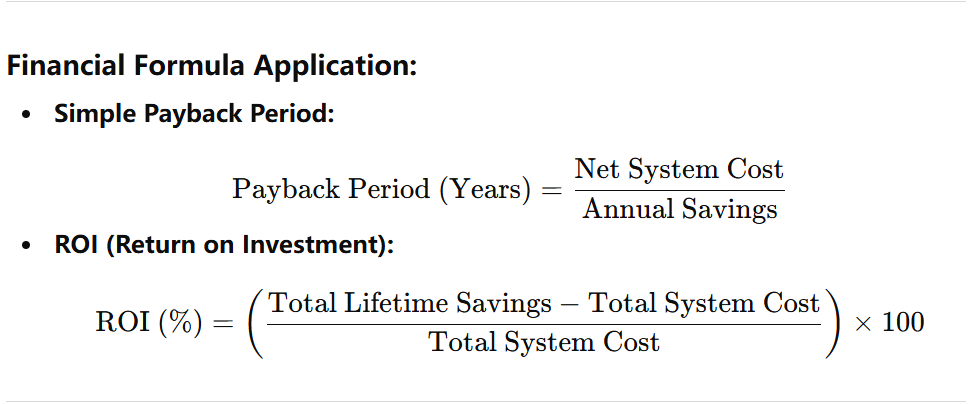
- Financial Formula Application:
Simple Payback Period:Payback Period (Years) = Net System Cost ÷ Annual Savings
ROI (Return on Investment):
ROI (%) =
(Total Lifetime Savings - Total System Cost) ÷
Total System Cost × 100
Pro Tip: For more accuracy, use an online calculator or request a detailed financial analysis from your installer that includes Net Present Value (NPV) and Internal Rate of Return (IRR).
Conclusion
Calculating your solar system’s ROI requires comprehensive consideration of various factors, including your energy demand, local policies, technology choices, and long-term financial goals. With precise planning and focus on lifetime costs, investing in solar energy remains one of the most reliable and rewarding choices for the coming decades.
Disclaimer: The data and case studies presented are based on publicly available research and models. Your specific ROI will vary depending on your individual system and location. It is recommended to obtain a personalized financial analysis from a certified solar installer.
Find Your Solar + Battery Storage Specialist Now!
* Fill out this form and our experts will help you find the perfect solar storage solution for your home or business.