As telecom operators face mounting pressure to reduce operational costs while meeting the demands of 5G expansion, energy expenses have emerged as the critical battleground for profitability. Energy consumption now accounts for 15-40% of total telecom OPEX, and this percentage continues to climb with denser network deployments. For decision-makers seeking telecom tower OPEX reduction strategies, a smart energy management system represents the most comprehensive solution available today.
This guide provides telecom operators, tower companies, and infrastructure managers with actionable insights into smart energy management systems, covering technical architecture, cost-benefit analysis, deployment scenarios, and real-world case studies. Whether you’re operating in urban centers or remote off-grid sites, understanding these systems is essential for maintaining competitive advantage in today’s cost-sensitive telecom landscape.
Quick Answer: Smart Energy Management System for Telecom Site OPEX Reduction
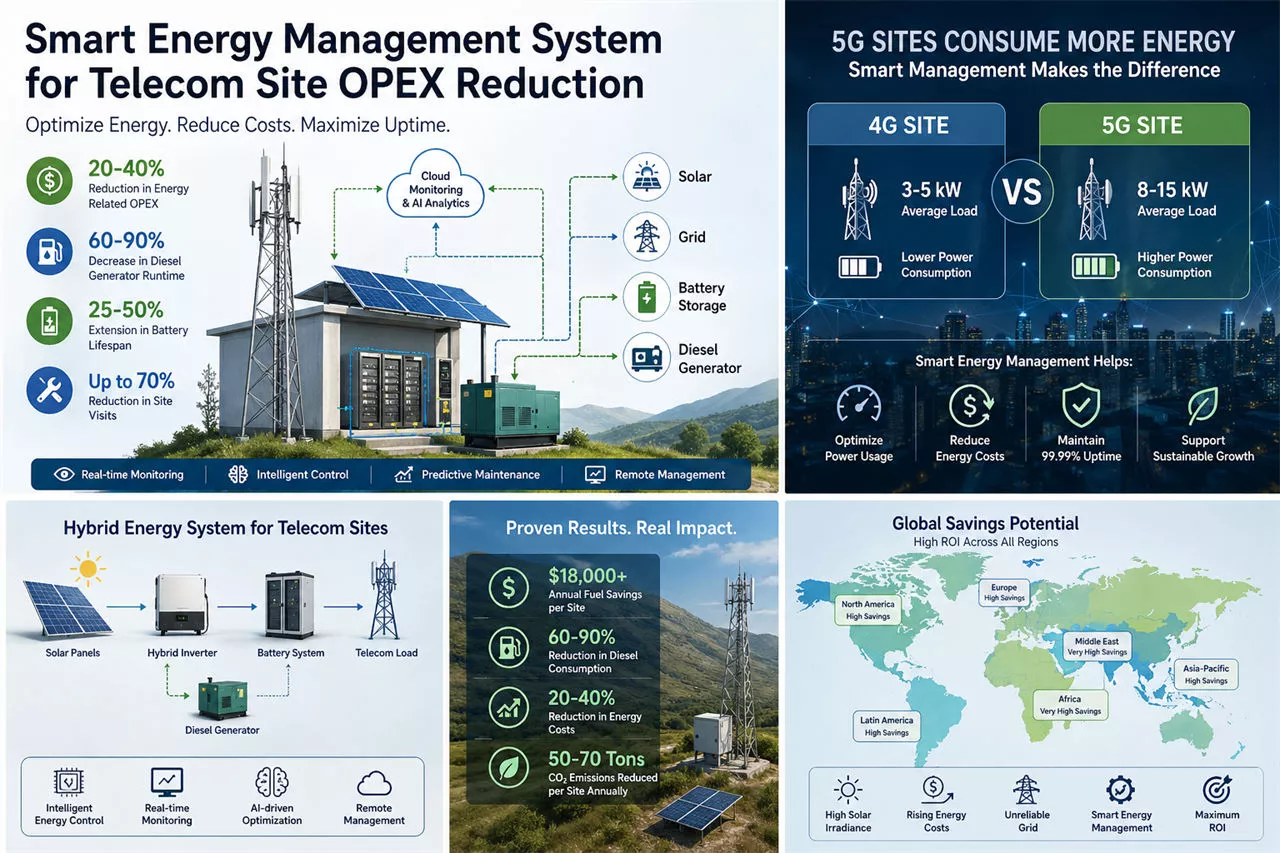
A smart energy management system (SEMS) is an integrated platform combining BMS, EMS, renewable energy sources, and AI-driven analytics with cloud monitoring to optimize telecom site energy consumption in real time.
Key benefits for telecom operators:
- 20-40% reduction in energy-related OPEX through intelligent load management
- 60-90% decrease in diesel generator runtime at hybrid sites
- 25-50% extension in battery lifespan through optimized charging cycles
- Predictive maintenance capabilities that reduce site visits by up to 70%
- Payback periods of 2-5 years depending on site type and location
The system works by continuously monitoring power flows, weather conditions, grid stability, and load patterns to make real-time decisions about energy source prioritization, battery charging/discharging schedules, and generator activation—maximizing renewable energy utilization while maintaining the 99.99% uptime that telecom services require.
Understanding Telecom Site Infrastructure
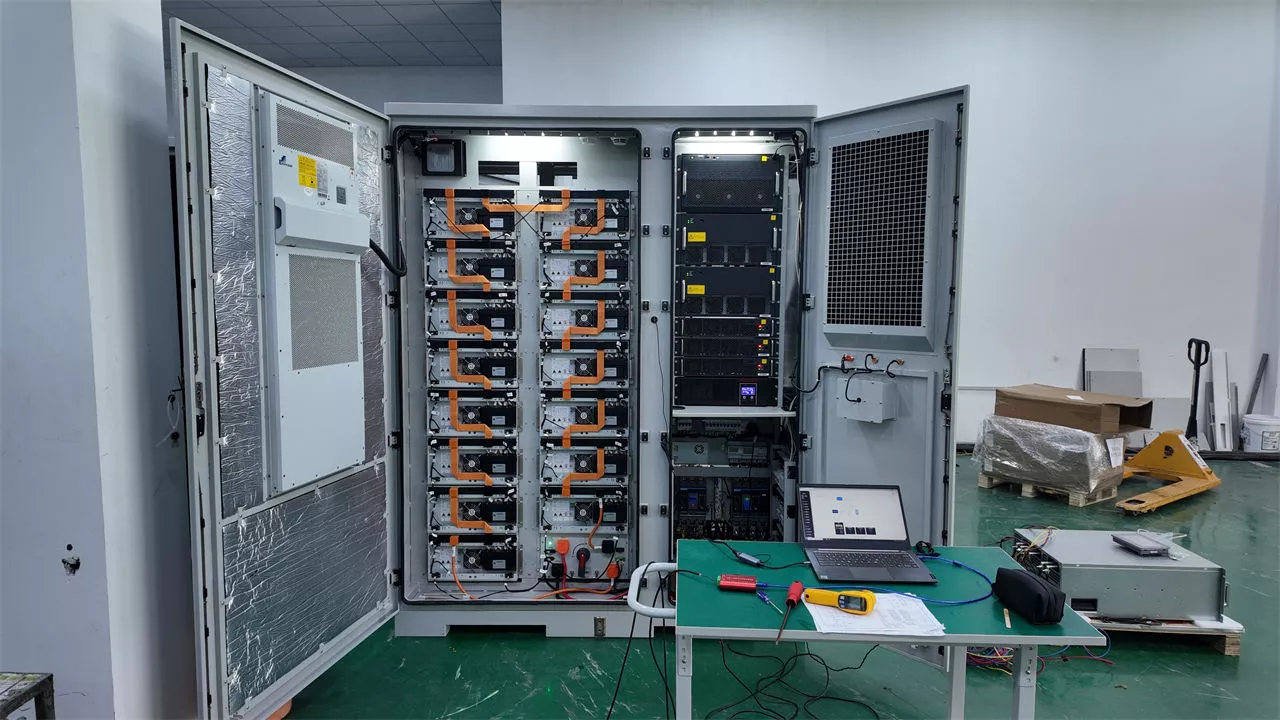
Before implementing a smart energy management system, telecom operators must thoroughly understand the infrastructure they’re seeking to optimize. A typical telecom site comprises multiple interconnected power systems, each contributing to both operational requirements and cost structures.
Power Systems: The Heart of Telecom Energy Consumption
Modern telecom sites depend on several power components working in coordination:
Rectifier Systems
Rectifiers convert AC grid power into DC power (typically -48V DC) for telecom equipment such as base stations, transmission systems, and network infrastructure. Traditional legacy rectifier systems may operate at approximately 85–90% efficiency, while modern high-efficiency telecom rectifiers from leading vendors can typically achieve 95–98% efficiency under optimal load conditions. This efficiency improvement directly reduces electricity consumption, lowers utility costs, and decreases heat generation—thereby also reducing cooling requirements and improving overall site energy performance. Advanced rectifier systems also support features such as module dormancy and intelligent load sharing, which automatically power down unused rectifier modules during low-traffic periods to further improve operational efficiency.
Backup Battery Systems
Battery banks provide critical backup power during grid outages. The telecom industry has largely transitioned from traditional lead-acid batteries to Lithium Iron Phosphate (LFP) technology:
| Battery Type |
Cycle Life (80% DoD) |
Lifespan |
Operating Temp |
Key Advantage |
| Lead-Acid |
300-500 cycles |
2-3 years |
20-25°C |
Lower upfront cost |
| LFP (Standard) |
4,000-6,000 cycles |
6-8 years |
0-40°C |
Better thermal stability |
| LFP (Premium) |
6,000-8,000 cycles |
10-15 years |
-20-45°C |
Extended service life |
All cycle life figures based on 80% depth of discharge (DoD) at 25°C ambient temperature.
LFP batteries typically offer 3–5× longer service life than traditional lead-acid alternatives, depending on operating conditions, depth of discharge (DoD), charging strategy, and thermal management. This significantly reduces battery replacement frequency, lowers lifecycle maintenance costs, and minimizes the operational burden of battery management across large-scale distributed telecom site portfolios.
Diesel Generators
Generators remain essential for off-grid sites and grid-unstable regions. A typical 30kVA generator running 24/7 consumes approximately $28,000–$35,000 in annual fuel costs at remote African sites. Beyond fuel costs, operators face expenses for:
- Logistics and delivery to remote locations
- Regular maintenance at 250-hour intervals
- Security measures against fuel theft (affecting 10-20% of deliveries in high-risk areas)
- Standby redundancy requirements
Energy Distribution Architecture
Power flows through the site via distribution units that manage allocation between active equipment, battery charging, and backup systems. Intelligent distribution units in smart energy management systems optimize this allocation in real-time based on load forecasts, grid pricing, and renewable generation availability.
Cooling Systems: The Hidden Energy Consumer
Climate control represents 45-55% of total site electricity consumption, making it a prime target for optimization. Traditional air conditioning operates at efficiency ratios of 2-4, while smart ventilation systems can achieve ratios of 15-30—i.e., 5 to 15 times higher performance.
Smart Ventilation Technologies
In regions where annual average temperatures range from 12-25°C and humidity stays below 85%, smart ventilation systems can reduce energy consumption by 20-70% compared to conventional air conditioning. These systems bring fresh external air into equipment rooms, pumping hot air out while maintaining appropriate thermal conditions for sensitive electronics.
Heat Exchange Systems
Heat exchangers provide efficient cooling by transferring heat from inside equipment rooms to external environments using isolated media. While effective, these systems require regular maintenance to prevent dust accumulation and corrosion on heat exchange cores, which can degrade efficiency over time.
Thermotank Isolation
Battery-specific thermal management allows operators to isolate temperature-sensitive batteries from less heat-sensitive equipment, significantly reducing the cooling load for the entire site. This approach can cut air conditioning workload by concentrating climate control only where needed.
Load Profiles: Understanding Energy Demand
Telecom site loads have evolved significantly with network technology advancement:
| Network Generation |
Typical Site Load |
Load Characteristics |
| 2G/3G |
2–3 kW |
Stable, predictable |
| 4G |
3–5 kW |
Moderate variation |
| 5G |
5–10 kW |
High variation, peak-heavy |
| 5G + Massive MIMO (add-on) |
+0.5–1.5 kW per sector |
Further increases peak demand |
A basic 5G site carrying two tenants requires 5-6 kW, compared to 3-4 kW just a few years ago. With Massive MIMO deployments adding approximately 1,000W per sector, energy demands continue to escalate—making intelligent management not just beneficial but essential for network viability.
What is a Smart Energy Management System?
A smart energy management system represents the integration of multiple intelligent technologies into a cohesive platform that optimizes energy consumption across telecom infrastructure. These systems move beyond simple monitoring to deliver autonomous decision-making that improves efficiency continuously.
Core Components of Smart Energy Management Systems
Battery Management System (BMS)
The BMS serves as the foundational layer for energy optimization at each site:
- Real-time monitoring of voltage, current, temperature, State of Charge (SOC), and State of Health (SOH)
- Predictive maintenance algorithms that identify failing batteries weeks before actual failure
- Optimized charging cycles that maximize cycle life while maintaining required backup capacity
- Cell balancing to ensure uniform performance across battery banks
- Communication protocols including Modbus, CAN, and RS485 for integration with broader network management systems
Modern BMS platforms like those from Vision-Batt deliver 24/7 visibility across thousands of sites through centralized dashboards, enabling operators to transition from reactive break-fix maintenance to proactive asset management.
Energy Management System (EMS)
The EMS layer coordinates multiple energy sources and loads across the site:
- Multi-source coordination managing solar, wind, grid, generator, and battery interactions
- Load prioritization ensuring critical services remain powered during shortage conditions
- Peak shaving to reduce demand charges during high-tariff periods
- Time-of-Use optimization scheduling high consumption for low-cost periods
- Remote configuration allowing parameter adjustments without site visits
Artificial Intelligence and Machine Learning
Advanced analytics transform raw data into actionable insights:
- Pattern recognition identifying inefficiencies invisible to human analysts
- Predictive algorithms forecasting load patterns, generation availability, and potential failures
- Autonomous optimization adjusting system parameters in real-time based on evolving conditions
- Anomaly detection identifying unusual consumption patterns that may indicate equipment issues or theft
Industry studies (including PowerX analysis) indicate that AI-based optimization can achieve 15–30% reduction in diesel consumption and up to 30% reduction in CO2 emissions by continuously optimizing generator runtime and fuel allocation.
Remote Monitoring and Control Platform
Cloud-based management enables fleet-wide visibility:
- Centralized dashboards displaying real-time status across all sites
- Automated alert systems for threshold violations and fault conditions
- Historical data analysis for trend identification and capacity planning
- Remote troubleshooting reducing mean time to repair (MTTR) by up to 40%
Smart BMS for Telecom Sites: Technical Specifications
When evaluating smart BMS solutions, telecom operators should focus on these critical parameters:
| Parameter |
Entry-Level Systems |
Premium Systems |
Impact on OPEX |
| Monitoring Granularity |
String-level |
Cell-level |
Early failure detection |
| Communication Protocol |
SNMP |
Multi-protocol (CAN, Modbus) |
System integration flexibility |
| Predictive Accuracy |
Reactive alerts |
2-4 week advance warning |
Reduced emergency visits |
| Update Capability |
Manual only |
OTA firmware updates |
Continuous improvement |
| Scalability |
Limited to 50 sites |
10,000+ sites |
Fleet management efficiency |
Integration Architecture
Smart energy management systems integrate with existing telecom infrastructure through standardized interfaces:
- Network Management System (NMS) integration for unified operational visibility
- RAN (Radio Access Network) controller integration for load-aware optimization
- Building Management System (BMS) coordination for facility-wide efficiency
- Utility meter integration for accurate consumption tracking and billing validation
The most advanced implementations achieve “感知-决策-执行-进化” (Sense-Decide-Execute-Evolve) capabilities, where the system continuously learns from operational data to improve decision-making algorithms over time.
Cost Analysis and ROI: Smart Energy Management System for Telecom Site OPEX Reduction
Understanding the financial implications of smart energy management systems requires analyzing both investment requirements and long-term operational savings. For telecom operators managing portfolios of hundreds or thousands of sites, these systems can generate substantial returns.
Initial Investment Breakdown
A comprehensive smart energy management system deployment typically includes:
Hardware Components
- Intelligent BMS platform: $3,000-$8,000 per site (depending on battery bank size)
- Smart power controllers: $2,000-$5,000 per site
- Sensors and monitoring equipment: $1,000-$3,000 per site
- Communication infrastructure: $500-$2,000 per site
Software and Integration
- EMS platform licensing: $50-$200 per site annually
- NMS integration development: $10,000-$50,000 (one-time, portfolio-level)
- Staff training: $1,000-$3,000 per technician
For hybrid renewable deployments (solar + storage):
- Solar panel array (5–15 kWp (kilowatt-peak)): $5,000-$15,000
- Battery storage system (50-200 kWh LFP): $15,000-$60,000
- Hybrid inverter/controller: $5,000-$12,000
- Installation and commissioning: $3,000-$10,000
Total Typical Investment Range: $25,000–$150,000 per site for hybrid systems with full smart management capabilities.
Operational Cost Comparison
The following analysis compares traditional vs. smart energy management approaches across a typical 5kW telecom site:
| Cost Category |
Traditional System |
Smart Energy Management |
Annual Savings |
| Grid Electricity |
$12,000-$18,000 |
$8,000-$12,000 |
$4,000-$6,000 |
| Diesel Fuel (off-grid) |
$28,000-$35,000 |
$3,500-$7,000 |
$21,000-$28,000 |
| Battery Replacement |
$3,000-$5,000 |
$1,000-$1,500 |
$2,000-$3,500 |
| Generator Maintenance |
$4,000-$8,000 |
$800-$1,500 |
$3,200-$6,500 |
| Site Visits (truck rolls) |
$6,000-$12,000 |
$1,500-$3,000 |
$4,500-$9,000 |
| Total Annual OPEX |
$53,000-$78,000 |
$15,800-$25,000 |
$30,000-$53,000 |
Based on average industrial electricity rates and diesel costs in Sub-Saharan Africa; figures will vary by region.
Investment Return Period Calculation
Simple Payback Period = Initial Investment ÷ Annual Net Cash Savings (excluding financing costs, depreciation, and tax effects)
For a typical hybrid deployment in high-cost regions:
- Investment: $75,000 per site
- Annual Savings: $35,000 per site
- Simple Payback: 2.1 years
ROI over 10 Years:
- Total Investment: $75,000
- Total Savings (10 years): $350,000
- Net Benefit: $275,000 per site
Advanced deployments with strong renewable resources and high utility rates can achieve payback periods under 18-24 months. Regions with lower energy costs or unreliable grid access may see longer payback periods but still deliver strong returns due to avoided downtime and maintenance costs.
Global Energy Economics and Solar ROI (2026 Outlook)
Energy economics vary dramatically across geographies, affecting both the urgency of optimization and the available savings for telecom operators and tower companies.
| Region |
Avg. Electricity Cost |
Diesel Cost (per liter) |
Solar Irradiance (kWh/m²/day) |
ROI Potential |
| North America |
$0.08–0.22/kWh |
$1.20–1.65 |
4.0–6.0 |
High |
| Western Europe |
€0.15–0.35/kWh |
€1.55–1.95 |
2.5–4.5 |
High |
| Eastern Europe |
$0.08–0.22/kWh |
$1.15–1.55 |
3.0–5.0 |
Medium–High |
| Middle East |
$0.03–0.12/kWh |
$0.55–0.90 |
5.5–7.0 |
Very High |
| South Africa |
$0.12–0.22/kWh |
$1.30–1.65 |
4.5–6.5 |
Very High |
| Sub-Saharan Africa |
$0.15–0.30/kWh |
$1.20–1.95 |
4.0–6.5 |
Very High/Critical |
| South Asia |
$0.08–0.14/kWh |
$0.95–1.35 |
4.0–5.5 |
High |
| Southeast Asia |
$0.07–0.17/kWh |
$0.85–1.25 |
3.5–5.5 |
High |
| Northeast Asia (Japan/South Korea) |
$0.11–0.18/kWh |
$1.10–1.45 |
3.0–5.0 |
Medium–High |
| China |
$0.06–0.12/kWh |
$1.00–1.35 |
3.5–5.0 |
High |
Currency Context: EUR/USD exchange rate as of Q2 2026 is approximately 1.18 (range 1.15–1.18 during April). Western Europe electricity and diesel costs shown in EUR; all other regions in USD.
Notes: Sub-Saharan Africa’s “Critical” classification reflects record fuel price volatility (e.g., Kenya diesel +33% in April 2026) and acute supply chain shocks from the Middle East conflict. South Asia range includes subsidized segments in India and higher tariffs in Sri Lanka/Pakistan.
The Middle East and Sub-Saharan Africa offer the highest ROI potential due to combination of high fuel costs, strong solar resources, and significant grid instability driving diesel dependency.
Application Scenarios: Smart Energy Management for Different Telecom Site Types
Smart energy management systems adapt to various site configurations and operational requirements. Understanding the appropriate deployment model for each scenario ensures optimal return on investment.
Off-Grid Sites: Maximum Savings Opportunity
Off-grid sites—representing approximately 15-20% of telecom infrastructure globally—present the greatest opportunity for smart energy management optimization. These sites operate entirely independent of utility grids, typically relying on diesel generators as primary power sources.
Key Challenges:
- Diesel logistics costs of $0.70-$1.35 per liter for remote delivery
- Fuel theft affecting 10-20% of deliveries in high-risk regions
- High generator maintenance requirements due to continuous operation
- Limited access for emergency repairs
Smart Energy Management Solution:
- Hybrid solar + LFP battery systems sized to provide 70-95% of energy needs
- Generator integration for backup during extended low-solar periods
- Intelligent load management to maximize battery utilization
- Predictive maintenance algorithms reducing emergency site visits
Real-World Impact:
According to GSMA research, hybrid solar-storage systems at off-grid telecom sites achieve:
- $5,000-$15,000 annual fuel savings per site
- 60-90% reduction in diesel generator runtime
- 3-7 days battery autonomy for extended cloud cover periods
- Generator runtime reduced from near-continuous operation (~168 hours/week) to less than 10–20 hours/month in optimized hybrid systems
For an off-grid site in Northern Kenya with a 3.5kW continuous load, transitioning from a diesel-only configuration to a solar-diesel hybrid system with battery storage:
| Metric |
Before (Diesel-only) |
After (Hybrid Solar + Storage) |
| Annual Fuel Cost |
~$30,000–$35,000 |
~$5,000–$10,000 |
| Generator Runtime |
Continuous / near-continuous operation (~720 hours/month) |
~90–120 hours per month (≈ 3–4 hours/day) |
| Site Availability (Uptime) |
~96–97% |
~99.2–99.8% |
| CO₂ Emissions |
~45–55 tons/year |
~8–15 tons/year |
Grid-Connected Sites: Peak Shaving and Cost Optimization
Grid-connected sites face different optimization priorities—managing demand charges, reducing peak consumption, and ensuring backup power quality.
Key Challenges:
- Time-of-Use (ToU) tariffs with peak period rates 2-4x higher than off-peak
- Demand charges based on peak power draw
- Grid instability causing equipment stress and premature failure
- Power quality issues affecting sensitive electronics
Smart Energy Management Solution:
- Battery storage for peak shaving during high-tariff periods
- Load scheduling to shift non-critical consumption to off-peak hours
- Grid quality monitoring and conditioned power delivery
- Automatic transfer to battery backup during grid disturbances
Urban Peak Shaving Implementation:
In cities like Nairobi and Lagos where Time-of-Use (ToU) tariffs apply, telecom sites can significantly reduce costs by storing grid energy during low-tariff periods (typically nighttime) and discharging during peak hours (typically 6 pm–10 pm). A 50 kWh battery system at a site with 10 kW peak demand can reduce monthly demand charges by $200–$400, while delivering an additional $300–$600 in energy cost savings.
5G Site Requirements: Addressing Higher Energy Demands
5G networks introduce unprecedented energy challenges that smart energy management systems are specifically designed to address.
5G vs 4G Telecom Site Energy Demand Comparison
| Component |
4G Requirement |
5G Requirement |
Key Impact |
| Base Station Power |
2–3 kW |
5–10 kW |
~2–4× increase depending on traffic load and Massive MIMO configuration |
| Cooling Load |
1–2 kW |
2–5 kW |
~2–3× increase due to higher heat density and active equipment load |
| Backup System Capacity |
4–8 hours autonomy |
4–8+ hours autonomy |
Similar runtime requirement, but higher absolute energy storage (kWh) needed |
| Total Site Load (Average) |
3–5 kW |
8–15 kW |
~2–3× increase in average power demand |
Smart 5G Energy Management:
- Massive MIMO optimization: Dynamic power allocation based on traffic demand
- Sleep mode coordination: Coordinated shutdown of unused radio units during low-traffic periods
- Edge computing integration: Localized processing reducing backhaul energy requirements
- AI-driven load prediction: Pre-positioning cooling and power resources based on anticipated demand
Ericsson’s research indicates that AI-native network management can achieve 20-30% site-wide energy savings through intelligent sleep modes and resource optimization. Combined with hardware advances, 5G sites can achieve energy efficiency per gigabyte that is 10x better than 4G—but absolute consumption still increases, making smart management essential.
Urban vs. Rural Deployment Considerations
| Factor |
Urban Sites |
Rural Sites |
| Grid Reliability |
Generally good |
Often unreliable |
| Solar Installation Space |
Limited rooftop |
Often available |
| Accessibility for Maintenance |
Easy |
Difficult/expensive |
| Load Density |
High |
Low |
| Primary Optimization Focus |
Peak shaving, grid quality |
Fuel displacement, autonomy |
| ROI Timeline |
2-3 years |
2-5 years |
Case Studies: Real-World Smart Energy Management Deployments
The following case studies demonstrate measurable outcomes from smart energy management implementations across diverse operating environments.
Case Study 1: IHS Towers Nigeria – Green Power Initiative
Company: IHS Towers, one of Africa’s largest independent tower companies
Region: Nigeria
Implementation: 600+ hybrid solar sites with intelligent energy management
Partner: Watt Renewable Corporation (Energy-as-a-Service model)
Business Context:
IHS Towers operates over 40,000 towers across Africa, Middle East, and Latin America. In Nigeria, the company faced escalating diesel costs ($1.60-2.40/liter) and significant security challenges for fuel logistics in northern regions.
Implementation Details:
- 10-15 kWp solar arrays per site
- 50-100 kWh LFP battery storage
- Intelligent hybrid controllers with remote monitoring
- Energy-as-a-Service PPA model with Watt Renewable Corporation
Results:
- Annual fuel savings: $18,000 per site
- Generator runtime reduction: 85% decrease
- Projected annual savings (full deployment): $49 million across portfolio
- Uptime improvement: From 97.5% to 99.5%
- CO2 reduction: Approximately 60 tons per site annually
Key Success Factors:
- Energy-as-a-Service model transferred capital requirements to specialist provider
- Long-term PPA (10+ years) enabled attractive financing terms
- Remote monitoring capability reduced operational overhead
- AI-driven optimization continuously improved system performance
Case Study 2: Airtel Africa – Renewable Energy Transition
Company: Airtel Africa
Region: Sub-Saharan Africa (multiple markets)
Implementation: 1,200+ sites with hybrid renewable energy systems
Investment: $150 million+ across portfolio
Business Context:
Airtel Africa serves customers across 14 African markets, with significant network presence in countries facing severe grid instability. The company committed to reducing its carbon footprint while managing escalating energy costs across its 15,000+ site footprint.
Implementation Details:
- Solar-diesel hybrid systems in 8 priority countries
- Smart BMS with predictive maintenance capabilities
- Remote monitoring platform with automated alerts
- Integration with existing NMS infrastructure
Results:
- Energy cost reduction: 35% across deployed sites
- Diesel consumption: Reduced by 12,000 liters per site annually
- Site visit reduction: 60% decrease in maintenance truck rolls
- Battery lifespan: Extended from 3 years to 7+ years through optimized cycling
- Payback achieved: Within 3.5 years of deployment
Regional Variations:
| Country |
Energy Cost Reduction |
Diesel Displacement |
Payback Period |
| Kenya |
42% |
75% |
2.8 years |
| Tanzania |
38% |
70% |
3.2 years |
| Uganda |
35% |
65% |
3.5 years |
| Rwanda |
40% |
72% |
3.0 years |
Case Study 3: MTN South Africa – Grid Stability Management
Company: MTN South Africa
Region: South Africa (Johannesburg/Gauteng)
Implementation: 500+ sites with advanced energy storage and smart management
Challenge: Stage 6 load shedding (power outages affecting operations)
Business Context:
South Africa’s national grid (Eskom) faces chronic capacity constraints, with Stage 6 load shedding indicating 6+ hours of scheduled daily outages. Telecom operators must maintain service during these disruptions while managing significantly increased backup power costs.
Implementation Details:
- High-capacity LFP battery systems (100-200 kWh per site)
- Automatic transfer switching with <50ms transition time
- Intelligent load management during extended outages
- Integration with South Africa’s time-of-use electricity tariffs
Results:
- 100% uptime maintained during load shedding events
- Energy cost reduction: 28% through time-of-use optimization
- Battery investment payback: 4.2 years (including avoided generator fuel/maintenance)
- Section 12BA (which expired on 28 February 2025) previously provided a 125% first-year capital allowance on qualifying renewable energy assets in South Africa.
Key Takeaway:
Prior to its expiry, South Africa’s Section 12BA enhanced tax deduction effectively reduced net capital investment by approximately 30%, accelerating payback timelines for qualifying projects commissioned before 28 February 2025.
Case Study 4: Ericsson Global – AI-Driven Network Optimization
Company: Ericsson (network infrastructure provider)
Region: Global deployment with Turkcell, SmarTone, and other MNOs
Implementation: AI-assisted energy management across multiple networks
Business Context:
As a major RAN infrastructure provider, Ericsson has deployed AI-driven energy management features across numerous customer networks, demonstrating the scalability of advanced optimization approaches.
Implementation Details:
- AI-native network management with sleep mode optimization
- Dynamic spectrum management reducing unnecessary power consumption
- Machine learning algorithms continuously improving energy efficiency
- Integration with multi-vendor RAN equipment
Results:
- Energy consumption reduction: 20-30% site-wide
- Network coverage maintenance: No degradation during sleep mode operation
- AI-assisted optimization: Demonstrated at Turkcell (Turkey) and SmarTone (Hong Kong)
- Pathway to Net Zero: Ericsson achieved its 2025 sustainability targets ahead of schedule (announced in 2024), demonstrating the effectiveness of AI-driven energy management.
Regional Insights: Smart Energy Management for Telecom OPEX Reduction by Geography
Global telecom operators must adapt smart energy management strategies to regional conditions, including electricity costs, renewable energy availability, regulatory frameworks, and infrastructure challenges.
North America: Grid Reliability and Sustainability Focus
Market Characteristics:
- High electricity costs: $0.10-0.22/kWh for industrial users (2026 estimate)
- Stable but expensive grid infrastructure
- Strong regulatory support for renewable energy
- ESG reporting requirements driving sustainability investments
Recommended Approach:
- Grid-connected sites with peak shaving capabilities
- Solar installations where space permits (rooftop/ground-mount)
- Advanced BMS for battery health optimization
- AI-driven demand response participation
Representative Electricity Prices (2025–2026):
| State/Country |
Industrial Rate |
Key Consideration |
| California, USA |
$0.18–$0.30/kWh |
High TOU variation and significant demand charges |
| Texas, USA |
$0.07–$0.12/kWh |
Deregulated market with price volatility |
| Ontario, Canada |
$0.09–$0.14/kWh |
Time-of-Use (ToU) tariffs apply |
| Mexico |
$0.07–$0.11/kWh |
Industrial subsidies and regulated pricing |
American Tower Investment:
American Tower has invested $350 million+ in renewable energy upgrades across its African portfolio, demonstrating the scale of commitment major tower companies are making to sustainable infrastructure.
Europe: Energy Efficiency and Carbon Reduction Mandates
Market Characteristics:
- High electricity costs: €0.12-0.35/kWh (highest globally)
- Strong renewable energy penetration
- Carbon reduction targets driving investment
- Energy-as-a-Service models gaining adoption
Regional Electricity Prices in Europe (2025–2026, Estimated):
| Country |
Household |
Industrial |
Tax Share |
| Germany |
€0.35–€0.45/kWh |
€0.16–€0.22/kWh |
20–30% |
| France |
€0.25–€0.35/kWh |
€0.12–€0.18/kWh |
15–20% |
| Spain |
€0.20–€0.28/kWh |
€0.10–€0.15/kWh |
18–25% |
| Hungary |
€0.09–€0.14/kWh |
€0.08–€0.12/kWh |
10–18% |
| Bulgaria |
€0.10–€0.15/kWh |
€0.09–€0.13/kWh |
10–15% |
Recommended Approach:
- Comprehensive site energy audits
- LED lighting and cooling system upgrades
- Solar + storage for off-grid sites
- Battery second-life applications for backup systems
Regulatory Drivers:
The EU’s energy efficiency directives and carbon pricing mechanisms create strong economic incentives for energy optimization. Operators with operations in multiple EU member states should leverage standardized approaches across borders.
Asia-Pacific: Growth Markets with Diverse Challenges
Market Characteristics:
- Rapid 5G deployment driving energy demand growth
- Significant variation in grid quality across markets
- Strong solar resource availability in many regions
- Government-backed rural coverage mandates
Regional Highlights:
China:
Industrial electricity costs approximately $0.08-0.12/kWh, with state-backed programs supporting telecom infrastructure modernization. 5G deployment has driven significant energy management innovation, with Chinese vendors developing advanced AI-driven optimization platforms.
India:
Electricity costs of $0.06-0.10/kWh with unreliable grid supply in rural areas. Telecom operators face significant diesel costs for backup generation, with hybrid solar solutions achieving payback periods of 2.5-4 years in high solar irradiance regions.
Southeast Asia:
Annual growth of 23% in solar-powered towers, with countries like Vietnam, Indonesia, and Philippines expanding renewable energy deployments. Average electricity costs of $0.07-0.15/kWh with significant variation between urban and rural areas.
Australia:
Electricity costs of $0.15-0.25/kWh with strong support for renewable energy. Large geographic footprint creates logistics challenges similar to Africa for remote site management.
Middle East: Solar-First Strategy
Market Characteristics:
- Highest solar irradiance globally: 5.5-7 kWh/m²/day
- Moderate electricity costs: $0.05-0.12/kWh
- Vision 2030 initiatives driving renewable investment
- Extreme temperatures requiring robust thermal management
Recommended Approach:
- Solar-first hybrid systems as default configuration
- Premium LFP batteries rated for high-temperature operation (up to 45°C)
- Integrated cooling optimization
- Water harvesting for panel cleaning in desert environments
Saudi Arabia Vision 2030:
National initiatives supporting renewable energy deployment include favorable financing terms and land allocation for solar projects. Telecom operators with Saudi operations should coordinate renewable deployments with national grid expansion plans.
Africa: Highest ROI Potential with Unique Challenges
Market Characteristics:
- Diverse grid reliability—ranging from stable (South Africa, Morocco) to absent (rural areas)
- Highest diesel dependency for off-grid sites
- Strong solar resource (4-6.5 kWh/m²/day across most regions)
- Growing regulatory support for renewable energy
- Significant financing gaps for infrastructure investment
Electricity Cost Analysis:
| Country |
Grid Cost |
Diesel Cost |
Hybrid ROI Potential |
| South Africa |
$0.12–0.22/kWh |
$1.30–1.65/L |
High |
| Nigeria |
$0.08–0.18/kWh |
$1.00–1.80/L |
Very High |
| Kenya |
$0.12–0.20/kWh |
$1.20–1.60/L |
Very High |
| Ethiopia |
$0.04–0.08/kWh |
$1.00–1.40/L |
Medium-High |
| Ghana |
$0.10–0.18/kWh |
$1.00–1.40/L |
High |
| Tanzania |
$0.08–0.15/kWh |
$1.10–1.50/L |
High |
IFC Investment:
In March 2026, the International Finance Corporation (IFC) committed $45 million to IPT PowerTech to retrofit and maintain 2,235 telecom tower sites across Ethiopia, Liberia, and Sierra Leone with solar-hybrid systems. The project is projected to cut power costs by up to 30% in Liberia, 26% in Sierra Leone, and 52% in Ethiopia, while reducing carbon emissions by more than 10,624 tCO₂e annually.
Projected Cost Reductions:
- Liberia: 30% electricity cost reduction
- Sierra Leone: 26% electricity cost reduction
- Ethiopia: 52% electricity cost reduction
Subsidy Programs:
- South Africa: The Section 12BA incentive (125% first-year deduction) expired on 28 February 2025. For new renewable energy investments in 2026, businesses can claim a 100% accelerated depreciation allowance on qualifying solar PV assets (under 1 MW) under Section 12B.
- Ethiopia: 40% of $150 million renewable subsidy allocation directed to mobile solar solutions
- Kenya: Tax exemptions on import duties and VAT for wind turbines and solar cells
ESCO Model Success:
Energy Service Companies (ESCOs) have proven successful in Africa’s telecom sector:
- AktivCo (Camusat subsidiary): 6,000+ ESCO sites across Africa
- Watt Renewable Corporation: 600+ hybrid sites in Nigeria under PPA
- Energy Vision: Operations across Ethiopia, Nigeria, and Gabon
Latin America: Growing Renewable Adoption
Market Characteristics:
- Moderate electricity costs: $0.08-0.20/kWh
- Strong grid infrastructure in major markets
- Growing renewable energy sector
- $150 million+ invested in renewable telecom projects in 2023
Recommended Approach:
- Solar-diesel hybrids for off-grid and weak-grid sites
- Grid-connected systems with demand management for urban deployments
- Battery storage for peak shaving under time-of-use tariffs
- Integration with growing regional renewable energy capacity
Industry Standards and Certifications for Telecom Energy Systems
Implementing compliant smart energy management systems requires adherence to international standards that ensure safety, reliability, and interoperability. Telecom operators and equipment vendors must navigate a complex landscape of regional and international requirements.
Battery Safety Standards
UL 1973: Standard for Safety for Batteries for Use in Stationary and Motive Auxiliary Power Applications
- Covers battery safety requirements for telecom backup applications
- Includes electrical, fire, and mechanical testing
- Required for North American deployments
IEC 62619: Secondary lithium cells and batteries for industrial applications
- International standard for lithium batteries in telecom use
- Specifies performance and safety requirements
- Includes vibration and shock testing relevant to tower environments
UL 9540 / UL 9540A: Energy Storage System Standards
- UL 9540: Overall system safety certification
- UL 9540A: Thermal runaway propagation testing
- Essential for large battery installations
UN38.3: Transportation Testing for Lithium Batteries
- Required for all lithium battery shipments (air, sea, land)
- Covers vibration, shock, altitude, temperature, and short circuit tests
- Mandatory for international equipment procurement
Power System Standards
IEC 62041: Power Supply and Distribution Equipment for Telecommunications
- Defines requirements for telecom power equipment
- Covers efficiency, safety, and performance criteria
IEC 62343: Power Supplies for Data Centers and Telecommunications
- Performance requirements for modern power systems
- Efficiency measurement standards
EN 50500: Electromagnetic Compatibility for Low-Voltage Installations
- EMC compliance for European deployments
- Ensures telecom power systems don’t interfere with network equipment
Quality Management Standards
ISO 9001:2015: Quality Management Systems
- Demonstrates consistent quality in manufacturing
- Required by major telecom operators for vendor qualification
- Ensures batch-to-batch consistency for deployed equipment
ISO 14001: Environmental Management Systems
- Increasingly required for ESG reporting
- Demonstrates commitment to environmental responsibility
- Supports sustainability disclosure requirements
Operator-Specific Requirements
Beyond international standards, major telecom operators maintain proprietary requirements:
- Vendor qualification lists with approved equipment catalogs
- Testing protocols specific to operational conditions
- Documentation standards for commissioning and maintenance records
- Integration requirements for network management systems
Telecom operators should engage early with regional authorities and major customers to understand specific requirements before equipment procurement.
Product Comparison: Smart Energy Management Solutions for Telecom Sites
Evaluating smart energy management solutions requires comparing technical capabilities, integration flexibility, and total cost of ownership across available options.
Key Selection Criteria
| Criteria |
Weight |
Evaluation Questions |
| Monitoring granularity |
High |
Cell-level vs. string-level monitoring |
| Predictive accuracy |
High |
Average warning time for battery failure |
| Integration capability |
High |
NMS/OSS compatibility |
| Scalability |
Medium |
Maximum sites per platform |
| Remote configuration |
Medium |
OTA updates, parameter changes |
| Local support |
High |
Service response time, spare parts |
| Certification compliance |
High |
UL, IEC, CE certification status |
Leading Solutions Overview
The smart energy management market includes solutions ranging from single-vendor integrated systems to modular approaches combining best-in-class components:
Integrated Solutions:
- Huawei’s smart energy management system with 96% rectifier efficiency
- Ericsson’s AI-native network energy management
- Nokia’s energy optimization software
Specialized Energy Management:
- PowerX AI-driven energy optimization
- Vision-Batt BMS platforms
- HighJoule hybrid power systems with integrated management
Battery Management Focus:
- Tier-1 LFP manufacturers with advanced BMS
- Second-life EV battery integrators
- Remote monitoring platform providers
Solution Comparison Table
| Feature |
Integrated Platform A |
Integrated Platform B |
Modular Approach |
HighJoule System |
| Rectifier Efficiency |
96% |
94% |
92% |
95% |
| BMS Monitoring |
Cell-level |
String-level |
Cell-level |
Cell-level |
| AI Predictive Maintenance |
Yes |
Limited |
Optional |
Yes |
| Solar Integration |
Native |
Native |
Requires add-ons |
Native |
| Remote Configuration |
Full OTA |
Partial |
Varies |
Full OTA |
| Max Site Capacity |
50,000+ |
10,000+ |
Varies |
20,000+ |
| Certification Coverage |
Global |
Regional |
Varies |
Global |
| Local Support Availability |
Global |
Regional |
Varies |
Regional |
| Payback Period (typical) |
2-4 years |
3-5 years |
2-5 years |
2-4 years |
HighJoule Product Range
As a specialized provider of telecom site energy solutions, HighJoule offers systems designed specifically for telecom operator requirements:
Smart Energy Management Features:
- AI-driven predictive diagnostics reducing emergency site visits by 60%+
- Cell-level BMS monitoring with 2-4 week advance failure prediction
- Round-trip efficiency exceeding 95% for optimal energy utilization
- Operating temperature range of -20°C to 45°C (no derating), with safe operation up to 60°C under derated conditions for harsh environments.
- Maximum charge rate of 1.0C (240A) enabling rapid solar energy harvesting
Hybrid Power Solutions:
- Pre-integrated solar + storage + management systems
- Configurable for 2kW-20kW continuous loads
- Battery storage from 20kWh to 200kWh capacity
- Turnkey deployment with installation and commissioning
After-Sales Support:
- 24/7 technical assistance
- Regional service teams with rapid response capability
- Comprehensive warranty coverage
- Remote diagnostic and resolution services
Operators exploring smart energy management solutions should contact HighJoule for customized site TCO analysis and deployment planning.
After-Sales Support and Service Excellence
Successful smart energy management deployment extends beyond initial installation to encompass ongoing support, optimization, and continuous improvement.
Essential Support Components
Remote Monitoring and Diagnostics
Modern systems enable remote identification and resolution of most issues:
- Real-time alerts for abnormal conditions
- Remote diagnostics reducing troubleshooting time by 40%
- OTA firmware updates improving functionality without site visits
- Performance dashboards for operational visibility
Predictive Maintenance Services
AI-driven predictive maintenance transforms asset management:
- Battery health trajectory analysis
- Generator performance degradation tracking
- Solar panel efficiency monitoring
- Cooling system performance optimization
Field Service Network
Geographic coverage ensures rapid response when physical intervention is required:
- Regional service teams with local knowledge
- Spare parts inventory at strategic locations
- Standardized response time commitments (typically 24-48 hours)
- Escalation procedures for critical issues
Service Level Agreement Considerations
When negotiating support contracts, telecom operators should address:
| Element |
Standard Offering |
Premium Offering |
| Response time |
24-48 hours |
4-8 hours |
| Remote support |
Business hours |
24/7 |
| Preventive visits |
Annual |
Quarterly |
| Spare parts |
Exchange program |
On-site inventory |
| Performance reporting |
Monthly |
Weekly |
| Account management |
Shared |
Dedicated |
Total Cost of Ownership Optimization
Ongoing support directly impacts TCO:
- Reduced downtime through proactive maintenance
- Extended equipment life through optimized operation
- Lower energy costs through continuous performance tuning
- Reduced truck rolls through remote resolution capability
Operators should evaluate total cost of ownership over 5-10 year horizons when comparing support options, as premium support services often deliver positive ROI through extended equipment life and reduced emergency maintenance.
Summary: Smart Energy Management System for Telecom Site OPEX Reduction
Smart energy management systems represent the most comprehensive approach to telecom site OPEX reduction, delivering measurable improvements across multiple operational and financial dimensions.
Key Takeaways
The Business Case is Compelling:
- Energy costs represent 15-40% of telecom OPEX and continue to rise
- Smart energy management delivers 20-40% reduction in energy-related costs
- Hybrid renewable systems achieve 60-90% diesel displacement at off-grid sites
- Typical payback periods range from 2-5 years depending on site type and location
Technical Excellence is Essential:
- Cell-level BMS monitoring enables 2-4 week predictive maintenance capability
- AI-driven optimization achieves 20-30% additional savings beyond hardware improvements
- LFP battery technology provides 6,000-8,000 cycle life (3x lead-acid alternatives)
- System integration requires adherence to UL, IEC, and regional certification standards
Regional Adaptation Maximizes Value:
- Sub-Saharan Africa: Highest ROI potential due to diesel costs and solar resources
- Middle East: Solar-first strategy optimal for extreme environments
- Europe: Peak shaving and carbon reduction primary drivers
- Asia-Pacific: 5G energy demands require robust management solutions
- Americas: Sustainability mandates driving adoption
Partner Selection Determines Success:
- Look for comprehensive solutions covering hardware, software, and support
- Verify certification compliance for target deployment regions
- Evaluate predictive maintenance capabilities and remote support infrastructure
- Assess long-term total cost of ownership, not just initial investment
HighJoule Solutions for Telecom Energy Management
HighJoule provides integrated smart energy management solutions designed specifically for telecom operator requirements:
- Pre-integrated hybrid power systems with embedded management intelligence
- AI-driven predictive diagnostics reducing operational costs
- Cell-level monitoring with industry-leading accuracy
- Global certification (UL, IEC, CE) for worldwide deployment
- Regional service teams ensuring rapid support response
For telecom operators seeking to reduce OPEX while maintaining the reliability and sustainability their networks require, smart energy management systems offer a proven, scalable solution. The investment pays for itself within 2-5 years, then continues delivering savings for the 10-15 year life of modern equipment.
Ready to optimize your telecom site energy costs? Contact HighJoule for a customized site TCO analysis and deployment plan.
References and Further Reading
This article draws upon data and insights from industry-leading sources including:
 Mobile solar containerFolding Photovoltaic ContainerMobile Photovoltaic Energy Storage Integrated ContainerSite Energy Photovoltaic ContainerC&I Energy Storage Systems261kWh Outdoor Energy Storage CabinetHousehold Wind-Solar Energy Storage Integrated Cabinet7.01MWh Energy Storage Container System6.9MWh Energy Storage Container System6.25MWh Energy Storage Container SystemPhotovoltaic Module615W-640W TOPCon Bifacial high efficiency PV module710W-730W TOPCon Bifacial high efficiency PV module580~600W TOPCon Bifacial high efficiency PV module625~660W BC Solar PanelPhotovoltaic modules 650W-700WBase Station Energy Storage10.24kWh Floor-standing lithium-ion batterySite battery cabinetOutdoor Photovoltaic Energy CabinetIndoor Photovoltaic Energy CabinetPhotovoltaic Microstation Energy CabinetHome Energy Storage SystemsHigh-voltage residential energy storage battery14.34-16.08kWh Floor-standing lithium-ion battery9.98kWh Floor-standing lithium-ion battery10.24kWh Floor-standing lithium-ion battery5.12kWh Wall-mounted lithium-ion batteryPhotovoltaic Storage Inverter7KW High-Efficiency Single-Phase Grid-Tied Photovoltaic Inverter3KW-4.5KW High-Efficiency Single-Phase Grid-Tied Photovoltaic Inverter6.2KW Single-phase off-grid inverter9000W+9000W Single-phase off-grid inverter7.5KW-9KW American standard split-phase off-grid inverterSolar BatteryHigh-voltage residential energy storage battery14.34-16.08kWh Floor-standing lithium-ion battery9.98kWh Floor-standing lithium-ion battery10.24kWh Floor-standing lithium-ion battery5.12kWh Wall-mounted lithium-ion batteryEnergy Management SystemSolar-Storage-EV-Diesel Cloud EMSCabinet-level EMU (Energy Management Unit)Station-level EMS (Energy Management System)Communication site energy cabinet management systemEnergy Management System (EMS) Client AppCustomized ProductsExpandable container house with solar energyExpandable container house solarFolding Container HouseExpandable container house with solar energyFolding Photovoltaic ContainerTelecommunication


 Highjoule
 2026-04-27