- Products
Highjoule provides a wide variety of energy storage products, such as industrial and commercial BESS, home energy storage systems, photovoltaic modules, and other solutions. As a top Chinese manufacturer, Highjoule delivers reliable, scalable, and affordable options for sustainable power management. Benefit from innovative and customizable solutions backed by global support.
Traditional optical cable transfer box (stainless steel)Box-type jumper-free optical cable transfer box (stainless steel)Book Type Terminal Box (Metal)Intermediate distribution framLine Side ODFEquipment Side ODFOptical assembly frame MDF72-core ODF distribution unit48-core ODF distribution unit24-core ODF distribution unitBook Type Terminal Box (Non-Metal)Outdoor optical cable terminal box (metal)
View More Mobile solar containerFolding Photovoltaic ContainerMobile Photovoltaic Energy Storage Integrated ContainerSite Energy Photovoltaic ContainerC&I Energy Storage Systems261kWh Outdoor Energy Storage CabinetHousehold Wind-Solar Energy Storage Integrated Cabinet7.01MWh Energy Storage Container System6.9MWh Energy Storage Container System6.25MWh Energy Storage Container SystemPhotovoltaic Module615W-640W TOPCon Bifacial high efficiency PV module710W-730W TOPCon Bifacial high efficiency PV module580~600W TOPCon Bifacial high efficiency PV module625~660W BC Solar PanelPhotovoltaic modules 650W-700WBase Station Energy Storage10.24kWh Floor-standing lithium-ion batterySite battery cabinetOutdoor Photovoltaic Energy CabinetIndoor Photovoltaic Energy CabinetPhotovoltaic Microstation Energy CabinetHome Energy Storage SystemsHigh-voltage residential energy storage battery14.34-16.08kWh Floor-standing lithium-ion battery9.98kWh Floor-standing lithium-ion battery10.24kWh Floor-standing lithium-ion battery5.12kWh Wall-mounted lithium-ion batteryPhotovoltaic Storage Inverter7KW High-Efficiency Single-Phase Grid-Tied Photovoltaic Inverter3KW-4.5KW High-Efficiency Single-Phase Grid-Tied Photovoltaic Inverter6.2KW Single-phase off-grid inverter9000W+9000W Single-phase off-grid inverter7.5KW-9KW American standard split-phase off-grid inverterSolar BatteryHigh-voltage residential energy storage battery14.34-16.08kWh Floor-standing lithium-ion battery9.98kWh Floor-standing lithium-ion battery10.24kWh Floor-standing lithium-ion battery5.12kWh Wall-mounted lithium-ion batteryEnergy Management SystemSolar-Storage-EV-Diesel Cloud EMSCabinet-level EMU (Energy Management Unit)Station-level EMS (Energy Management System)Communication site energy cabinet management systemEnergy Management System (EMS) Client AppCustomized ProductsExpandable container house with solar energyExpandable container house solarFolding Container HouseExpandable container house with solar energyFolding Photovoltaic ContainerTelecommunication
 - Solution
From urban businesses to remote off-grid sites, Highjoule delivers customizable energy storage that optimizes power usage, reduces costs, and ensures uninterrupted electricity supply across global markets.
Site Energy Management SystemPV-Replacing-Diesel ScenarioBase station stacked photovoltaic systemBase Station Equipment Room Energy ScenarioHybrid Energy Communication SiteCompact Communication SiteBase Station Energy Storage Solution
View More - Case
Highjoule's successful energy storage projects worldwide. See how Highjoule bess transform home power and industrial operations. Real-world case studies with proven results.
Maldives 135kW/261kWh Hybrid Grid-Connected and Off-Grid Liquid-Cooled Energy Storage System ProjectTibet High-Altitude 395.2 kW Solar-Storage Integrated Microgrid Project4 Sets of 46 kW Foldable PV Container Systems in RomaniaSudan 40-foot Foldable Photovoltaic Energy Storage SystemJamaica 10kW/15kWh Integrated Residential Energy Storage System ProjectUkraine 46kWp/50kWh Foldable Photovoltaic Container SystemCambodia 100kW/215kWh Photovoltaic-Storage System Project
View MoreIndustrial Energy StorageMaldives 135kW/261kWh Hybrid Grid-Connected and Off-Grid Liquid-Cooled Energy Storage System ProjectTibet High-Altitude 395.2 kW Solar-Storage Integrated Microgrid Project4 Sets of 46 kW Foldable PV Container Systems in RomaniaSudan 40-foot Foldable Photovoltaic Energy Storage SystemUkraine 46kWp/50kWh Foldable Photovoltaic Container SystemCambodia 100kW/215kWh Photovoltaic-Storage System ProjectBulgaria 100kW/215kWh Photovoltaic Storage System Project365 Mobile Energy Storage Container ProjectResidential Energy StorageJamaica 10kW/15kWh Integrated Residential Energy Storage System ProjectCameroon 5KWp-5KW-5KWh Domestic Energy Storage ProjectSweden Gothenburg Residential Solar ProjectUnited States Residential Wind-Solar-Storage Integrated Cabinet ProjectCosta Rica Residential Energy Storage ProjectGermany Balcony Solar ProjectKenya Household Energy Storage System ProjectMali Home Energy Storage System ProjectBase Station Energy StorageSatellite Communication Base Station Indoor Energy Cabinet Integration ProjectSpain 86KWh Photovoltaic Storage System ProjectEnergy Project at the Mauritania Site, AfricaShanghai Fengxian Tietao – Qinhuo Station, Photovoltaic and Energy Storage Retrofit Project for Communication SiteKenya Rural Outdoor Energy Storage System ProjectMauritania Site Energy Storage Cabinet ProjectLaos 2.5kW Photovoltaic Energy Storage Power Station Solution - Industrial Layout
- About Us
Established in 2002, HighJoule (HJ Group) is a leading and professional energy storage company in China, dedicated to providing efficient, intelligent, and green energy storage solutions for global customers.
View More
The company owns two well-known sub-brands: Huijue and LZY Energy.
Leveraging global expertise and local innovation, HighJoule (HJ Group) drives impactful energy transitions, enabling sustainable energy management for users worldwide through high-efficiency storage solutions.
HighJoule (HJ Group)'s China headquarters is located in Shanghai, combining world-class technological innovation with China's advanced manufacturing ecosystem. Whether for commercial and industrial applications, residential energy storage systems, or complex microgrid solutions, HighJoule (HJ Group)'s products have been successfully deployed across multiple sectors, helping clients enhance energy utilization efficiency and reduce energy costs. - News Center
Highjoule’s News Center provides the latest company updates, industry insights, and technological innovations, showcasing the enterprise’s cutting-edge technologies and brand influence.
China’s First Energy Storage REIT Launches, Officially Opening the Door to Trillion-Yuan Asset SecuritizationHighjoule(HJ Group) Secures Contract for Centralised Procurement of Microgrid Equipment at Engineering Group HeadquartersNew Developments in AIDC Green Power Direct Connection Under the 80% ‘Compute-Power Coordination’ ThresholdEnergy Storage | When Energy Storage Meets ‘OpenClaw’Smart Energy Management System for Telecom Site OPEX Reduction: The 2026 Complete GuideFrom Production to Consumption: The Chain Reaction of the Energy CrisisThe 139th Canton Fair Concludes Successfully; “Energy + Communications” Dual-Drive Strategy Receives High Acclaim from Global Buyers
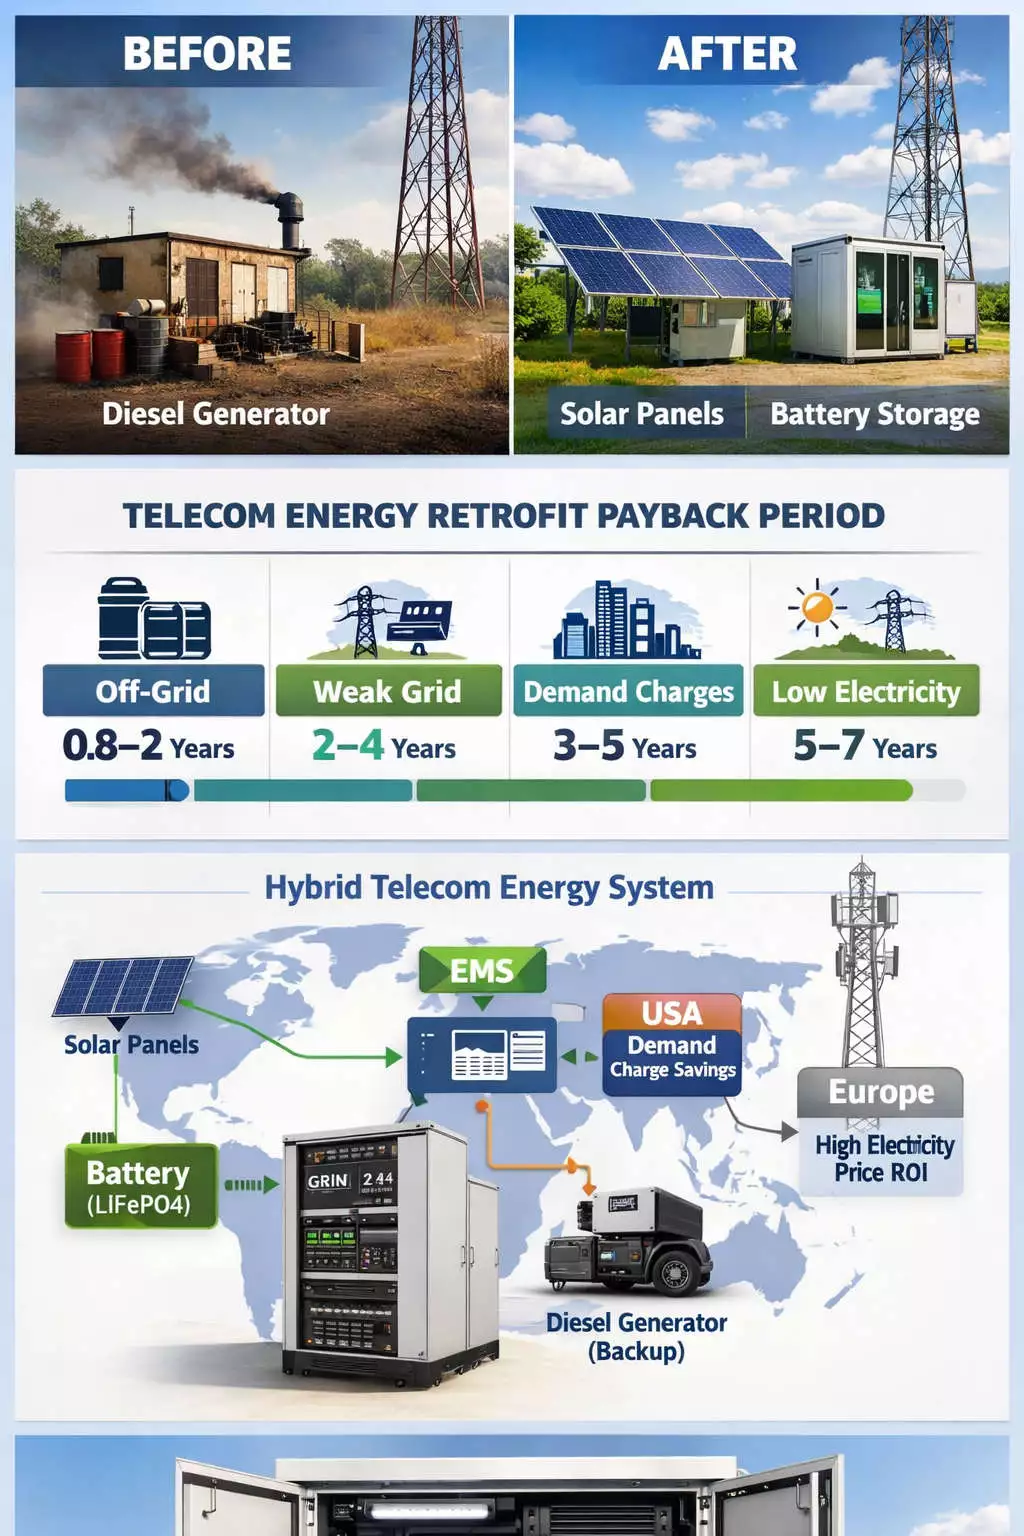
View MoreNews CenterChina’s First Energy Storage REIT Launches, Officially Opening the Door to Trillion-Yuan Asset SecuritizationHighjoule(HJ Group) Secures Contract for Centralised Procurement of Microgrid Equipment at Engineering Group HeadquartersNew Developments in AIDC Green Power Direct Connection Under the 80% ‘Compute-Power Coordination’ ThresholdEnergy Storage | When Energy Storage Meets ‘OpenClaw’Smart Energy Management System for Telecom Site OPEX Reduction: The 2026 Complete GuideFrom Production to Consumption: The Chain Reaction of the Energy CrisisThe 139th Canton Fair Concludes Successfully; “Energy + Communications” Dual-Drive Strategy Receives High Acclaim from Global BuyersOff-Grid Telecom Solar System Deployment Time (2026): Cost & TimelineCompany NewsHighjoule(HJ Group) Secures Contract for Centralised Procurement of Microgrid Equipment at Engineering Group HeadquartersThe 139th Canton Fair Concludes Successfully; “Energy + Communications” Dual-Drive Strategy Receives High Acclaim from Global BuyersHighjoule Group Preview of the 2026 Spring Canton Fair: “Dual-Drive Strategy of New Energy and Telecommunications”Base Station Solar Overlay SolutionHighjoule(HJ Group) Launches C&I Energy Storage Arbitrage Cloud Platform, Driving New Opportunities in European Energy Markets Through AI-Powered Full-Chain SolutionsHighjoule(HJ Group) Participates in Drafting National StandardHighjoule (HJ Group) Participates in the Compilation of the Technical Standard for Smart Building Microgrids, Officially ReleasedHighjoule(HJ Group) cordially invites you to attend the 2026 Romania Green Energy ExpoIndustry UpdatesNew Developments in AIDC Green Power Direct Connection Under the 80% ‘Compute-Power Coordination’ ThresholdFrom Production to Consumption: The Chain Reaction of the Energy CrisisOff-Grid Telecom Solar System Deployment Time (2026): Cost & TimelineIsrael Strikes Iran — Is the Energy Market Turning Upside Down?Telecom Site Energy Retrofit Payback Period (2026): Real Costs, ROI, and Global Case StudiesReliability Delivered: Highjoule’s Micro-grid in a BoxThe End of the Solar Export Tax Rebate Era: Industry Enters a New Reshuffling CycleWhat Is 5.5G? How Will It Bridge 5G and 6G?Employee ActivitiesTime Flies Like a Song · United in Companionship ‖ Highjoule’s November Staff Birthday CelebrationThe Eighth “Huijue Cup” Futsal Tournament Concludes SuccessfullyEarly Autumn Warmth · Celebrating Birthdays Together ‖ September Employee Birthday PartyTo celebrate the achievements together, the Foreign Trade Department of Shanghai Huijue Group held a grand celebration for the first half of 2025FAQsEnergy Storage | When Energy Storage Meets ‘OpenClaw’Smart Energy Management System for Telecom Site OPEX Reduction: The 2026 Complete GuideIn the AI Era, the Real Core Isn’t Low Carbon — It’s Reliable BatteriesHow Can Zero-Carbon Industrial Parks Achieve Energy Savings, Cost Reduction, and Emissions Reduction Goals?With the power system under strain, what key roles are energy storage technologies playing?What exactly does long-duration energy storage “store”? Why is it indispensable for renewable energy?How Does a BESS Work?Can balcony solar become the mainstay of residential photovoltaics? A promising new frontier or an overhyped false trend?Blog - Contact Us


 Highjoule
 2026-04-10